
The Laffer curve is a model of how much tax revenue a government can pull in dependent on the rate of tax it levies on the people. It is named after the American economist Arthur Laffer who promoted it though he didn’t invent it. The theory says that if the rate of tax (say income tax for simplicity) is 0% the government obviously raises no revenue and cannot finance public works. The same also holds if the government taxes income at 100% since the people either leave the country or just curl up and die. So the graph of tax revenue versus tax rate must look something like this:
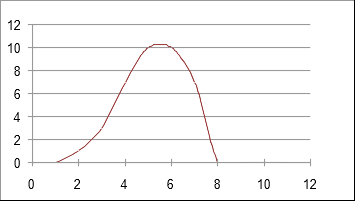
There is some tax rate at which the government can raise the maximum amount of tax revenue. To the left of this maximum any increase in the taxation rate results in more revenue. To the right any increase in taxation rate results in LESS revenue. The theory does not specify at what level of taxation the maximum revenue exists, merely that such a maximum must exist.
Clearly it would be desirable to establish on empirical grounds for any given country where this maximum is. This maximum could vary with time as for example in time of war, as well as times of recession or prosperity.
I have constructed a spreadsheet with official data of GDP [1], tax burden [2], population [3] and inflation [4] from 1980 with the hope of constructing an empirical Laffer curve for the UK. This is more difficult than it appears as the data is not in one place and there are different measures of GDP. I have used GDP at market price which is the price at which goods and services are sold or offered in the marketplace. The market price is the sum of the cost of production and indirect taxes. Similarly there are various measures of inflation. I believe that if I had used other measures than those I have it would not change my conclusions.
Another difficulty is that tax rates have not changed much in the last 75 years – between 28% and 37% – so only a narrow sliver of the Laffer curve can be investigated. The revenue (in nominal terms) has increased by a factor of 3 or more in that time, so inflation has to be taken into account.
Here is how the GDP has changed sinced 1980 and how inflation has taken its toll:
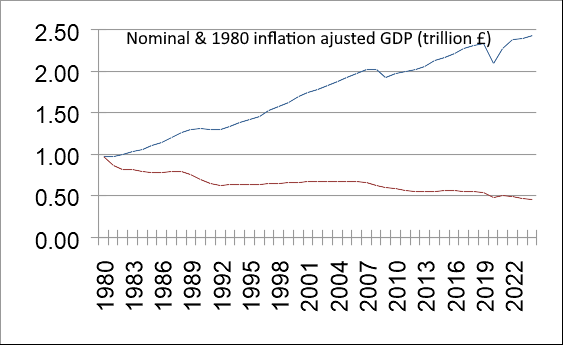
When governments specify a tax regime they do not know how much revenue the various taxes will bring in although they say they do. The reason for any discrepancy between prediction and actuality is that people change their activities to avoid the tax where possible. The statistics give us the actual overall tax burden not the desired tax burden nor how the tax burden is spread across the populace. So a particular tax regime (tax the rich) may have quite different consequences to another (tax the workers) even though the overall tax burden is the same. The consequences of tax changes may spread out over several years.
Perhaps the most striking fact to emerge from the statistics is not the Laffer curve but how the GDP per capita has changed since 1980:
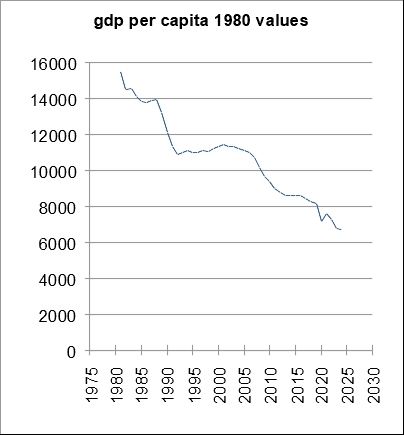
GDP per capita in real terms has decreased by a factor of two since 1980. Look no further to find out why one income used to be able to support a family and now two incomes are required. In nominal terms GDP per capita has doubled since 1980 but we all know that our money is worth less than it did and the country as a whole produces less than it did. The above graph shows how much worse off we are than we were in 1980. Demands by narrow sectors of the workforce to restore their wages to 1980 levels ignore the fact the everybody else is in the same boat.
The graph of tax revenue versus tax rate in nominal terms is shown below with dates showing the trajectory.
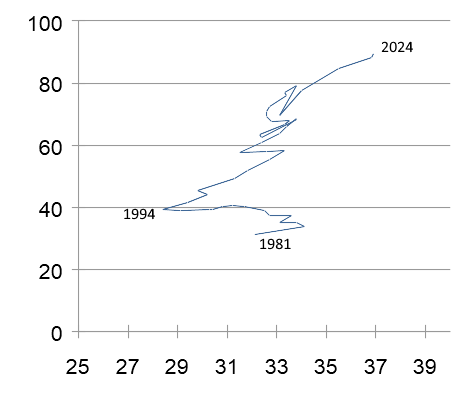
Nominal Tax Revenue (tens of billions) versus the percentage taxation rate relative to GDP .
The line indicates the trajectory through time from 1981 to 2024. The 1980’s was a period of tax cuts and reduction in government expenditure. Since 1994 the tax take has only gone up as taxes have gone up indicating we are on the left of the Laffer curve. But this is an illusion caused by the use of nominal values.
The graph of tax revenue in 1980 £ versus tax rate (ie taking inflation into account) looks like this:
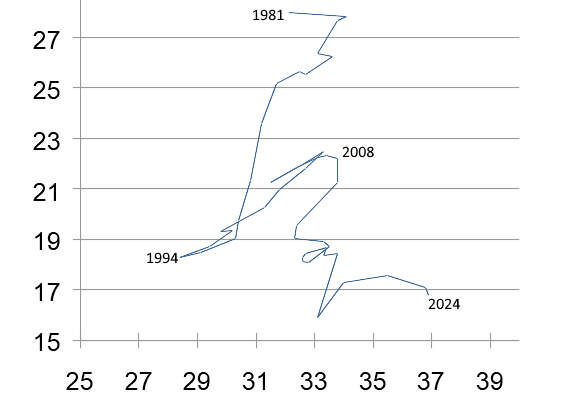
Tax Revenue (tens of 1980 £billions) versus the percentage taxation rate relative to GDP .
The trajectory shows that in the 1980’s the reduction in taxes did reduce the tax revenue indicating that we were on the left of the Laffer curve. Since the Great Financial Crisis of 2008 increases in taxation have only reduced the tax take. We are on the right of the Laffer curve. Attempts to increase real tax revenue by increasing taxes only get us deeper in the mire.
The fact that the trends showing which side of the Laffer maximum we are on persist for years and even decades indicates that the current tax rates (33% + or -) are near the Laffer maximum and that the shape of the maximum is quite narrow.
Fiddling the taxation rate by increasing taxes on this and that is of course only part of the story. The other side of the coin is what the tax revenues are spent on, or indeed how much the government borrows in addition to the tax it raises. What is required is an effective policy to produce growth and reduce the size of the state in comparison to the private sector. Part of this must be to reduce the cost of energy as this is what drives the economy. The UK has very high electricity costs relative to the rest of the world rendering our industry uncompetitive. That is only a small part of any plan to get us out of the doom loop.
References
[1] https://data.worldbank.org/indicator/NY.GDP.MKTP.KN?locations=GB
[2] https://ifs.org.uk/taxlab/taxlab-key-questions/how-have-government-revenues-changed-over-time
[3] https://www.macrotrends.net/global-metrics/countries/gbr/united-kingdom/population
[4] https://www.inflationtool.com/british-pound/1980-to-present-value